Compiled By: ECO Staff Writer
In August 2015, an intensive research effort in Greenland began to study some of the key processes contributing to sea rise. Among these processes is the rapid melting of the Greenland ice sheet. Researchers intend to answer just how fast changes are occurring and how much sea rise they could cause.
The answer to how much and how fast is critical. If all the ice on Greenland melted, scientists estimate that sea levels would surge 18 ft, destroying most of the planet’s coastal cities and resulting in a myriad of deadly disasters usually reserved for apocalyptic movies.
In fact, according to a July 2015 paper co-authored by NASA scientist James Hansen and 16 scientists from the world’s leading climate science institutions, if greenhouse gas emissions are not reduced, “...multi-meter sea level rise would become practically unavoidable. Social disruption and economic consequences of such large sea level rise could be devastating. It is not difficult to imagine that conflicts arising from forced migrations and economic collapse might make the planet ungovernable, threatening the fabric of civilization.”
In late August, U.S. President Barack Obama traveled to Alaska where one of the highlights was his visit to Exit Glacier. The President said, “Markers throughout Exit Glacier show how much it's receded over time. The impacts of climate change are real, and the people of Alaska are living with them every day. It's never been more important for us to work together to address this challenge.”
In his weekly address before the trip, the President said, “Alaska’s glaciers are melting faster too, threatening tourism and adding to rising seas. And if we do nothing, Alaskan temperatures are projected to rise between 6°C and 12°C by the end of the century...”
While the future of global climate is based on projections, sea rise is continuously monitored in real-time by NASA. According to Dr. Tom Wagner of the Goddard Space Flight Center, satellite images show that “sea levels are rising around the world and in the last 20 years, they’ve risen by over 3 in. on average.”
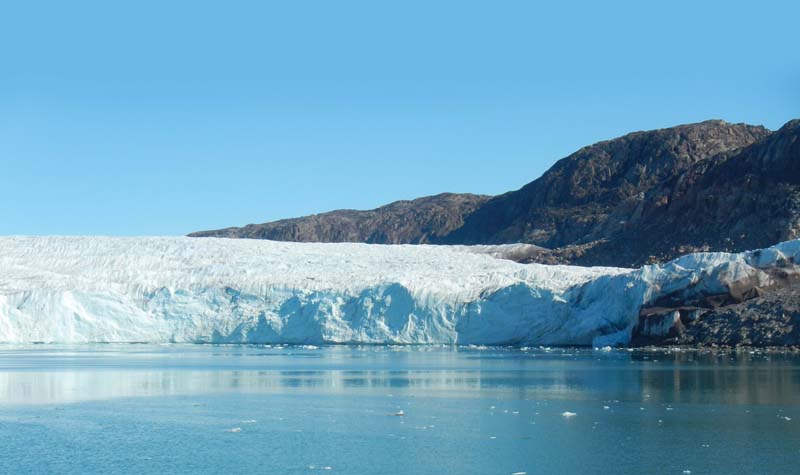
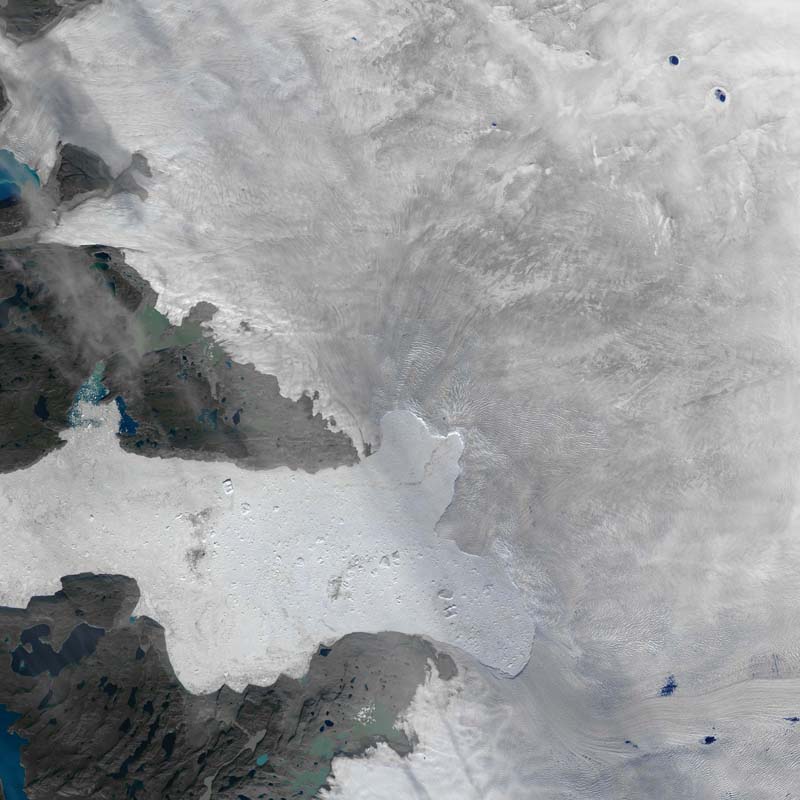
Western Greenland coastline 31 July 2015 during the TerraSond / Cape Race Bathymetry survey.
Photo credit: JPL / NASA.
What is NASA doing to understand how much sea levels could rise in the future? Wagner cites three main efforts:
1) Developing the technologies to study sea level rise and deploying them on satellites and aircraft;
2) Putting scientists out in the field to better understand the processes behind sea level rise to study what’s going on, both on the ice and in the oceans around it; and
3) Pulling all the gathered data into models that help NASA understand the processes of ice loss and to produce the climate/sea rise forecasts that society needs to plan for 10, 50, or even 100 years out.
Wagner adds, “What people really need to take away is that sea level is rising and it’s going to continue to rise. And it’s rising enough that it’s already impacting us.”
As the planet warms, the volume of the oceans expand, which accounts for about half of the sea level rise. The other half comes from melting ice that’s on land, such as the glaciers and ice caps in Alaska and Canada and the major ice sheets of Greenland and Antarctica.
Wagner says that NASA’s GRACE Satellite is remarkable because it allows them to measure changes in the weight of the ice sheet. “…what we’ve found is that in the Greenland case, we’re not only losing ice, but the ice loss seems to be accelerating. And that’s something that we’re trying to account for in our models as we move forward.” Remarkably, satellite measurements from NASA and its partners show that, across two decades, seas have risen more than 9 in. in some places, while in others, like the coast of California, the change has been much smaller.
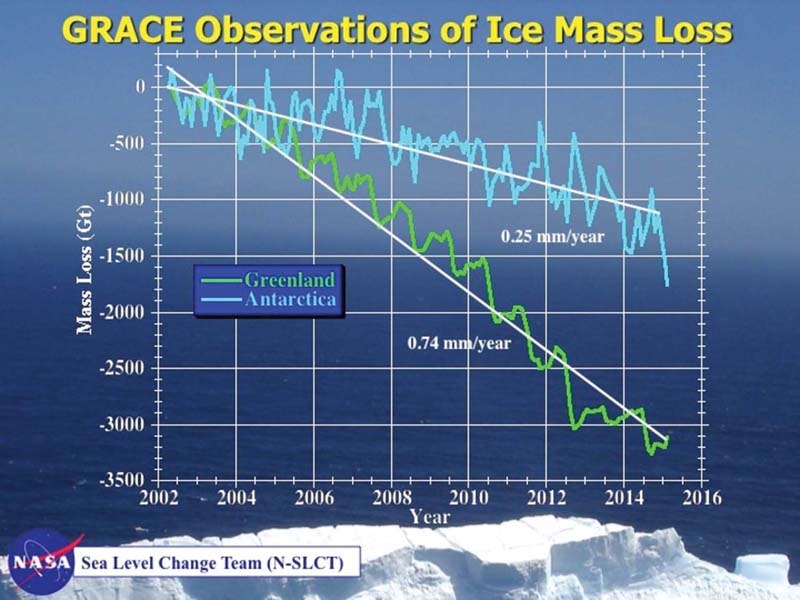
NASA’s Gravity Recovery and Climate Experiment (GRACE) twin satellites have measured the loss of ice mass from Earth’s polar ice sheets since 2002. Image credit: Steve Nerem/CU-Boulder.
"Sea level along the west coast of the United States has actually fallen over the past 20 years because long-term natural cycles there are hiding the impact of global warming," said Josh Willis, an oceanographer at NASA's Jet Propulsion Laboratory in Pasadena, California.
“However,” Wills adds, “there are signs this pattern is changing. We can expect accelerated rates of sea level rise along this coast over the next decade as the region recovers from its temporary sea level ‘deficit.’”
According to Hansen’s paper, “If the ocean continues to accumulate heat and increase melting of marine-terminating ice shelves of Antarctica and Greenland, a point will be reached at which it is impossible to avoid large-scale ice sheet disintegration with sea level rise of at least several meters.”
His paper, titled “Ice melt, Sea Level Rise and Superstorms,” submitted for review via the journal of Atmospheric Chemistry and Physics, suggests that “ice sheet disintegration is a highly nonlinear process and poses a danger of rapid sea level rise.”
In fact, Hansen’s alarming study concludes that the glaciers of Greenland and Antarctica will melt 10 times faster than previous estimates, raising ocean levels 10 ft in as little as a half century.
The reason? Feedback processes, including the cooling of the Southern Ocean’s surface, could exponentially increase the amount of freshwater injected into the rising oceans. According to the authors, these processes, which they demonstrate have occurred in the planet’s past, are already underway. Because “ice sheets in contact with the ocean are vulnerable to non-linear disintegration in response to ocean warming” and “ice sheet mass loss can be approximated by a doubling time up to sea level rise of at least several meters,” the scientists break with the findings of the IPCC. They conclude that the IPCC’s widely quoted 2°C limit on global warming is not safe.
But is Hansen’s paper accurate? Will our coasts be inundated with water so high that it wipes out entire cities? Will the ice cap melt continue to accelerate? NASA has launched an urgent, 5-year, $30 million study that will help scientists find out.
Oceans Melting Greenland
Launched in August 2015, Oceans Melting Greenland (OMG) will pave the way for improved estimates of sea level rise by addressing a few questions. To what extent are the oceans melting Greenland’s ice from below? Will the ice melt at a linear rate or will it go exponential on us?
The situation is urgent, to say the least, and NASA is acting now. Over a 5-year campaign, OMG will observe changing water temperatures on the continental shelf surrounding Greenland and how marine glaciers react to the presence of warm, salty Atlantic water.
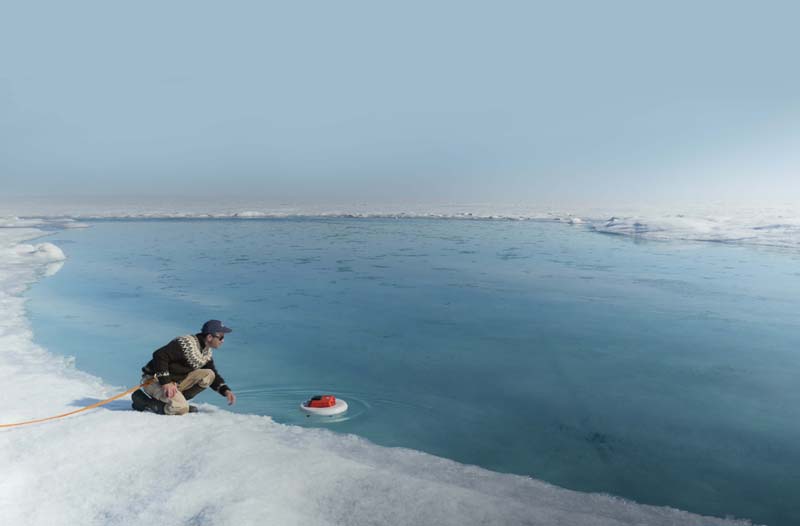
Laurence C. Smith, Chair of Geography at University of California, Los Angeles, deploys an autonomous drifter in a meltwater river on the surface of the Greenland ice sheet on July 19, 2015. The floating instrument was quickly swept away by the fast-moving glacial waters and ultimately swallowed by a moulin, a sinkhole in the ice. Although the scientists will never be able to recover the device from the depths of the ice sheet, the measurements it took and transmitted on its way down the waters will help scientists better understand how the network of streams and rivers that form on the surface of the ice sheet when ice melts in the spring and summer contributes to sea level rise. Photo credit: NASA/Jefferson Beck.
The complicated geometry of the seafloor steers currents on the shelf and often determines whether Atlantic water can reach into the long narrow fjords and interact with the coastal glaciers. Because knowledge of these pathways is a critical component of modeling the interaction between the oceans and ice sheet, OMG will facilitate improved measurements of the shape and depth of the seafloor in key regions.
OMG will use NASA’s G-III to fly the Glacier and Ice Surface Topography Interferometer (GLISTIN) in order to generate high-resolution, high-precision elevation measurements of Greenland’s coastal glaciers during the spring. Annual surveys by GLISTIN will measure glacier thinning and retreat over the preceding season. A second aircraft campaign, also on the NASA G-III, will occur each summer to deploy 250 expendable temperature and salinity probes along the continental shelf to measure the volume and extent of warm, salty Atlantic water. These data, along with fundamental new and critical observations of airborne marine gravity and ship-based observations of the seafloor geometry, will provide a revolutionary dataset for modeling ocean/ice interactions and lead to improved estimates of global sea level rise.
They will also measure water flow on the Greenland ice sheet. Laurence Smith, a University of California Los Angeles (UCLA) researcher working with NASA explains that Greenland is not a vast plane of ice and snow but "a very wet icescape covered with branching streams, rivulets and even large flowing blue rivers" that rapidly remove meltwater from the ice sheet surface. The stream systems move the meltwater into sinkholes (called moulins) that penetrate deep into the ice sheet and eventually allow meltwater to escape into the ocean.
While these Greenland campaigns are vitally important to improving scientific understanding, after reading the James Hanson paper one might ask whether a similar effort should be employed in the Southern Ocean. After all, Antarctica contains vastly more ice than Greenland, and the paper clearly states that while the Greenland ice melt could eventually slow to more linear-rates, “the amplifying feedbacks in the Southern Ocean, including expanded sea ice and SMOC slowdown likely will continue to grow and facilitate increasing Antarctic mass loss.”
"The prevailing view among specialists has been that East Antarctica is stable, but we don't really know," said glaciologist Eric Rignot of the University of California Irvine and JPL. "Some of the signs we see in the satellite data right now are red flags that these glaciers might not be as stable as we once thought. There's always a lot of attention on the changes we see now, but as scientists our priority needs to be on what the changes could be tomorrow."
August Glacier Calving Sets Records
Greenland’s melt isn’t slowing yet, however. A calving event that occurred 14-16 August 2015 may represent the largest calving of a glacier into the sea in many years, leading analysts to worry what these events could mean for coastal communities around the globe.
Summer is the season to watch for ice loss from the outlet glaciers lining the perimeter of Greenland. Jakobshavn—Greenland’s fastest-moving glacier—is notorious for such losses. In 2014, the glacier shed kilometers of ice from its front. In 2015, the glacier lost yet another large chunk of ice. The satellite images above show the difference across three dayst. Some observers have speculated that the area of ice lost could be the largest on record.
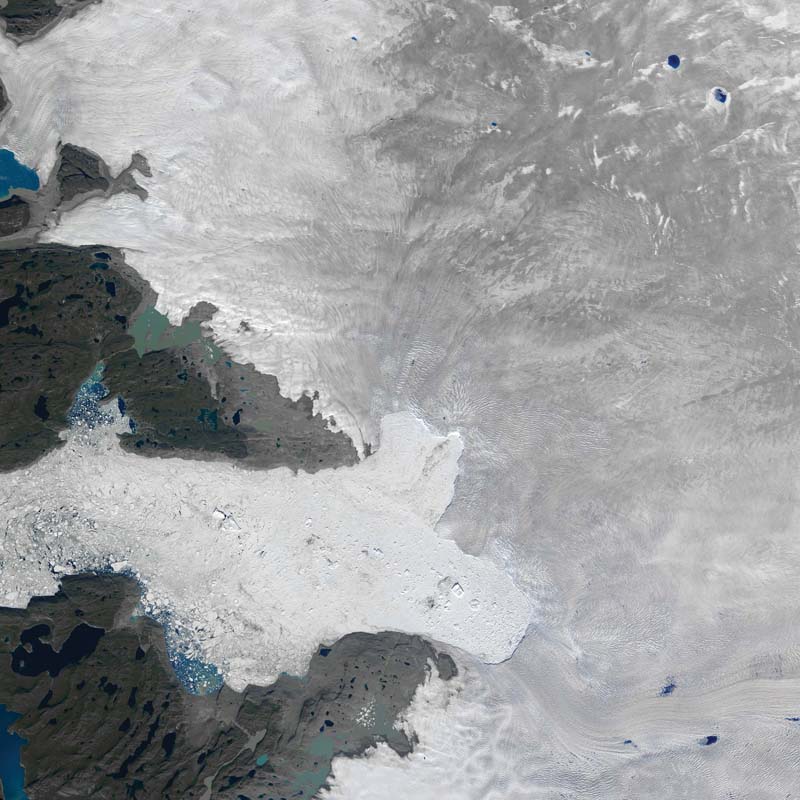
The front of Greenland’s giant Jakobshavn glacier on 31 July 2015, before its most recent large calving event.
Photo credit: NASA Earth Observatory images by Joshua Stevens, using Landsat data from the U.S. Geological Survey.
The calved front of Greenland’s giant Jakobshavn glacier on August 16. Analysts believe the size of this calving may be a new record.
Photo credit: NASA Earth Observatory images by Joshua Stevens, using Landsat data from the U.S. Geological Survey.
“The calving events of Jakobshavn are becoming more spectacular with time, and I am in awe with the calving speed and retreat rate of this glacier,” said Eric Rignot. “These images are a very good example of the changes taking place in Greenland.”
Scientists track the calving rate and speed of Jakobshavn in part because the glacier is responsible for draining a large portion of the Greenland Ice Sheet. This glacier alone could contribute more to sea level rise than any other single feature in the Northern Hemisphere.
“What is important is that the ice front, or calving front, keeps retreating inland at galloping speeds,” Rignot said. According to University of Washington glaciologist Ian Joughin, the end of every summer for the last several years has seen Jakobshavn’s calving front move about 600 m (2,000 ft) farther inland than the summer before.
Jakobshavn’s ongoing retreat coincides with faster rates of flow. In the summer of 2012, Jakobshavn accelerated to speeds not seen before, surging at a rate of 17 km (10 mi) per year. On average, the glacier moved nearly three times faster in 2012 than it did in the mid-1990s.
Commenting on data gathered from the Greenland Ice Sheet before this calving event even occurred, the National Snow & Ice Data Center wrote, “Although 2015 is not at satellite-era record levels (set in 2012), there was a large rate of loss overall. A combination of low snowfall in the past winter season and warm temperatures with extensive melting resulted in a large loss of ice from the ice sheet in the northwest. Some areas in the southern one-third of the ice sheet have less loss than average. Greenland typically loses mass due to melt runoff through the summer, although in recent years both low snow and runoff, and an increase in glacier outflow have combined to significantly shrink the thickness of the ice sheet, contributing to sea level rise.”
In short, Greenland is running a deficit when it comes to its ice budget. Whether this trend continues and just what it means for rising seas is firmly on the agenda for NASA in next 5 years.
“It's pretty certain we are locked into at least 3 ft of sea level rise and probably more," said Steve Nerem of the University of Colorado, Boulder, and lead of NASA’s Sea Level Change Team. "But we don't know whether it will happen within a century or somewhat longer."
NASA’s campaign to probe how warming ocean waters are triggering Greenland glacier degradation could help answer this question.
More Information
- Oceans Melting Greenland project page at omg.jpl.nasa.gov.
- Hansen J., M. Sato, P. Hearty, R. Ruedy, M. Kelley, V. Masson-Delmotte, G. Russell, G. Tselioudis, J. Cao, E. Rignot, I. Velicogna, E. Kandiano, K. von Schuckmann, P. Kharecha, A. N. Legrande, M. Bauer, and K.-W. Lo. 2015. Ice melt, Sea Level Rise and Superstorms: Evidence from Paleoclimate Data, Climate Modeling, and Modern Observations that 2°C Global Warming is Highly Dangerous. Atmos. Chem. Phys. Discuss. 15:14 (20059-20179). www.atmos-chem-phys-discuss.net/15/20059/ 2015/acpd-15-20059-2015.pdf.
- Arctic Sea Ice Blog (2015, August). Jakobshavn Record Retreat. neven1.typepad.com/blog/2015/08/jakobshavn-record-retreat.html Accessed August 26, 2015.
- Earth Observatory (2014, June 11). Retreat of Jakobshavn Glacier, Greenland. earthobservatory.nasa.gov/IOTD/view.php?id=83837.
- NASA’s Climate Change Sea Rise site at climate.nasa.gov/vital-signs/sea-level/.