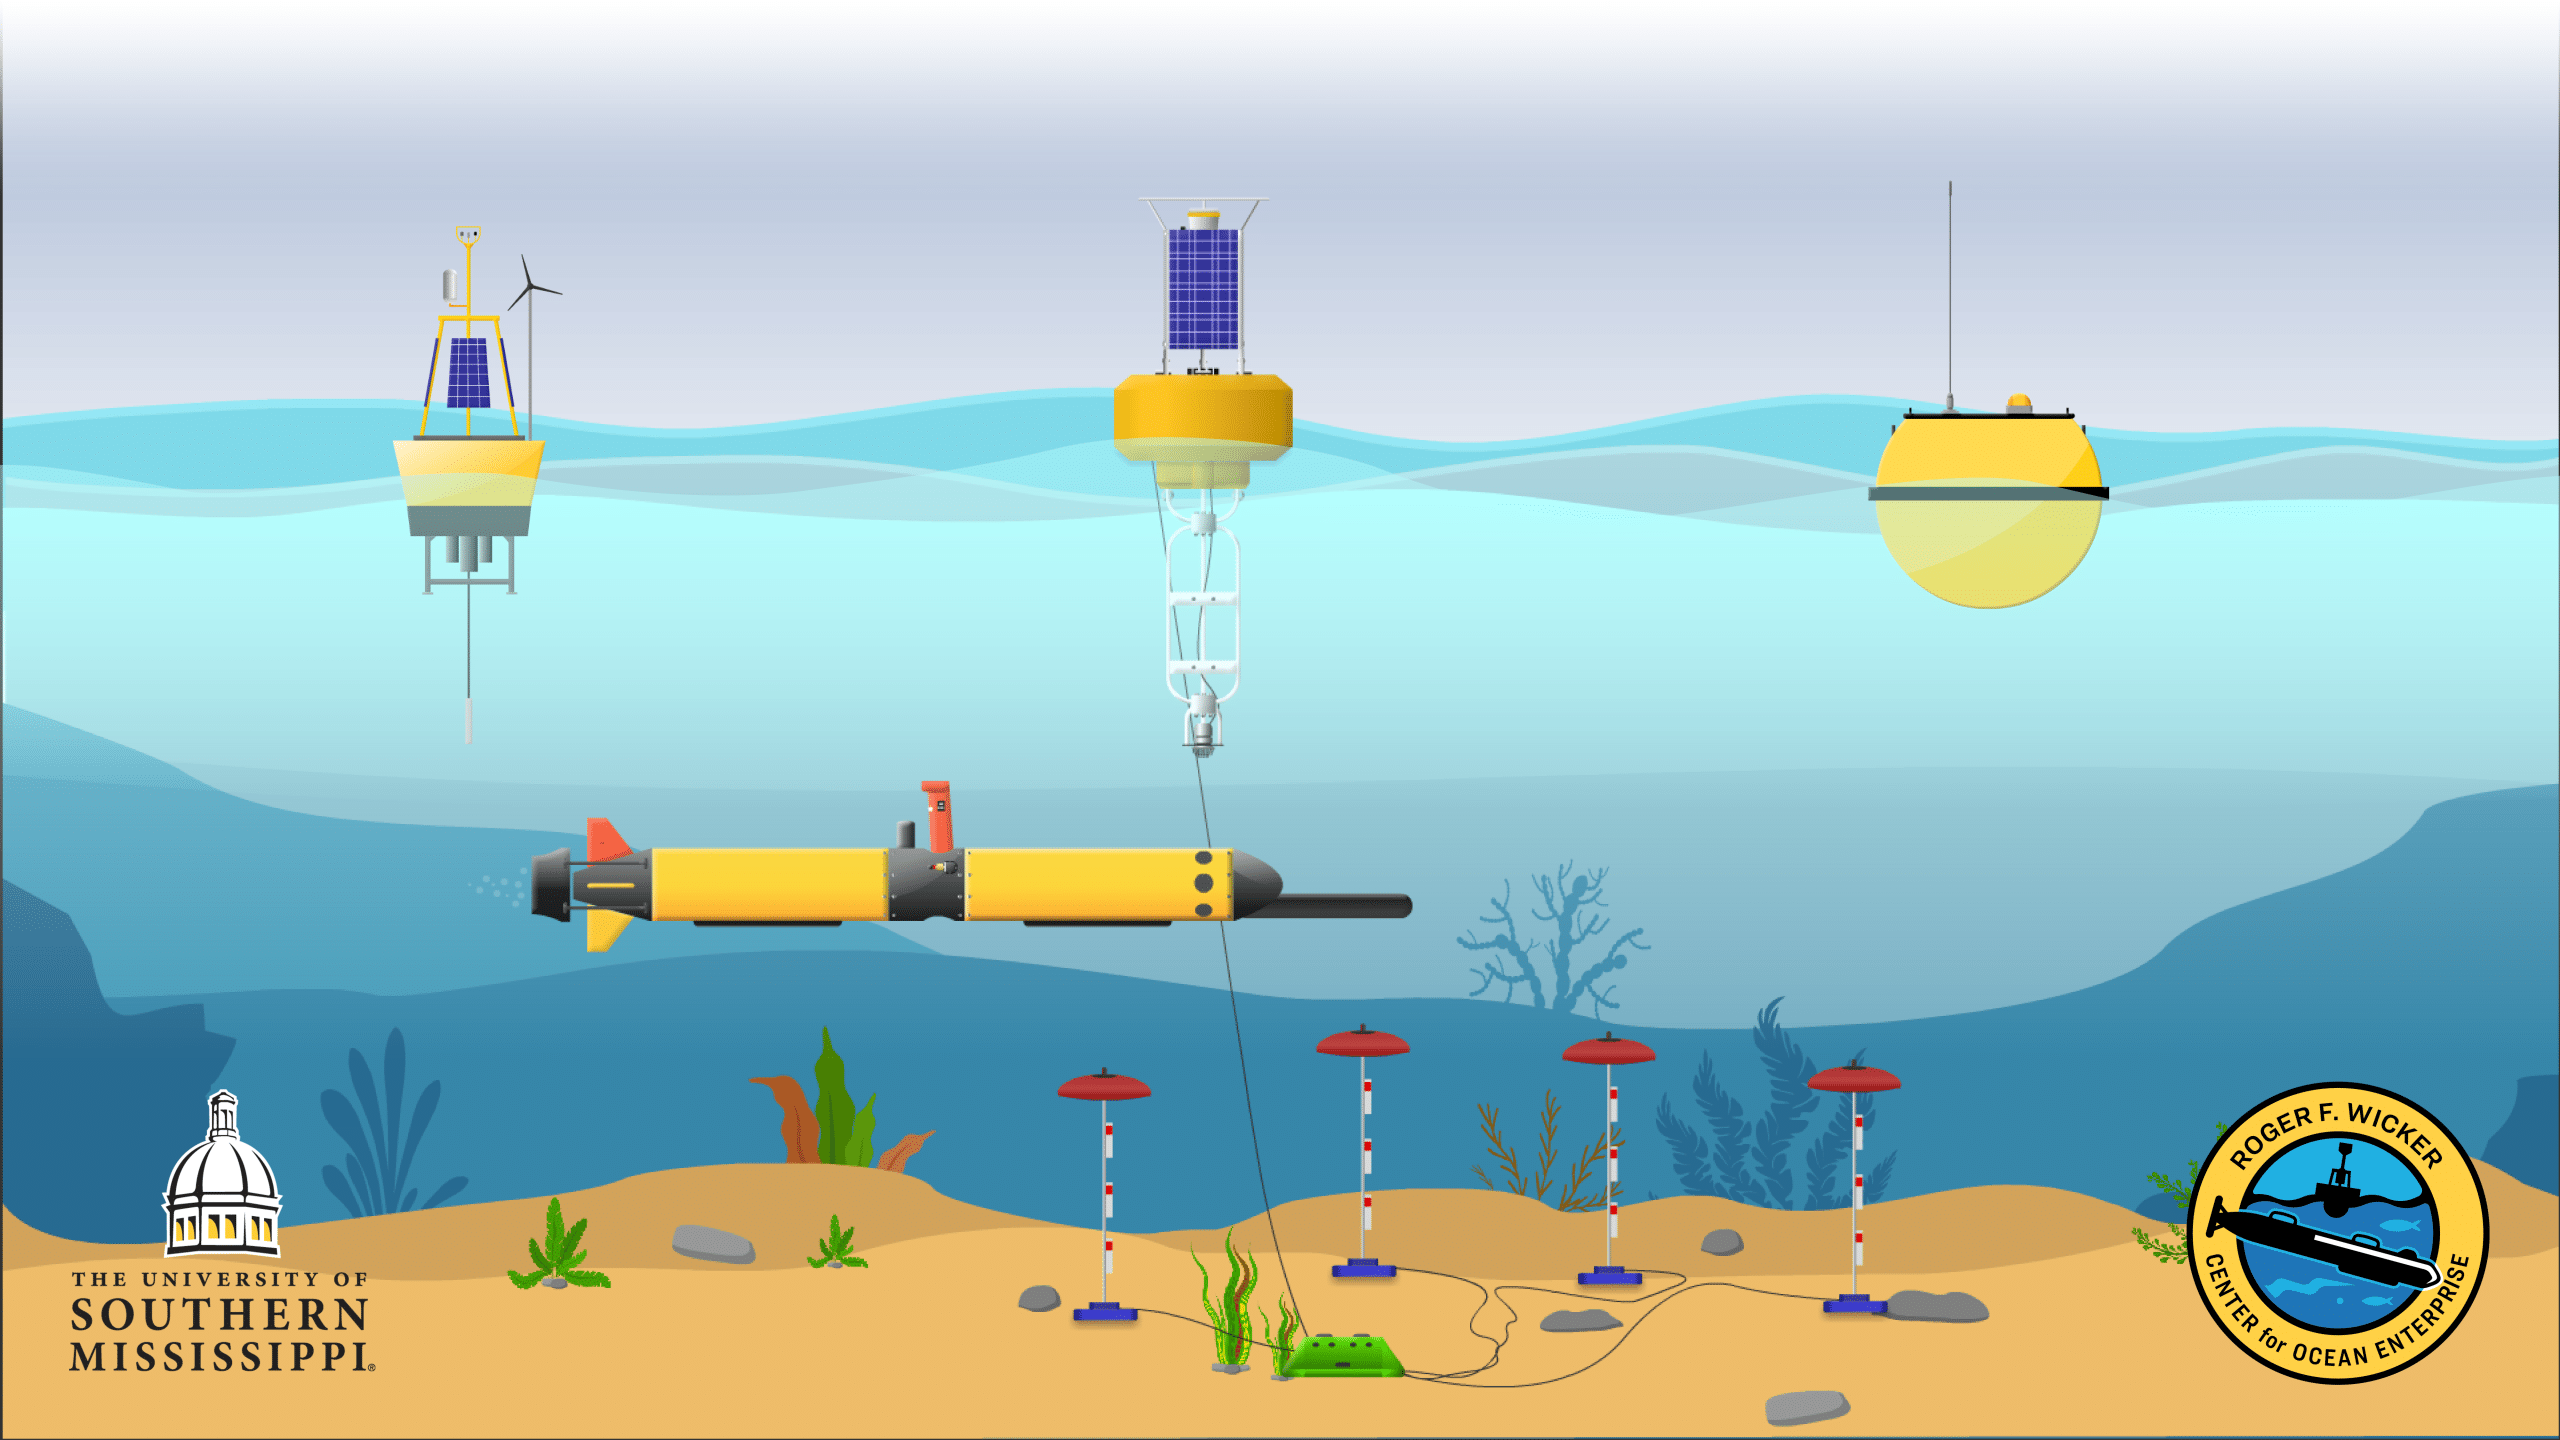
We support our partners with at-sea testing and evaluation by wiring the Gulf of Mexico with Coastal CUBEnet, a re-locatable environmental and oceanographic tool critical for testing and performance evaluation of uncrewed maritime systems (UMS). As a result, our partners can demonstrate, test, and refine their technology in an area with a broad range of oceanographic, acoustic propagation, and environmental variabilities. Creating a four-dimensional ocean cube supports a comprehensive understanding and predictive modeling of the surface and subsurface environments in the northern Gulf of Mexico.

The test area is equipped with four (or more) moored ocean platforms and numerous uncrewed vessels. (Image credit: USM)
We perform or support on-water testing for the National Oceanic and Atmospheric Administration (NOAA), the US Army Corps of Engineers (USACE), the US Coast Guard (USCG), US Naval Research Laboratory (NRL), the Naval Meteorology and Oceanography Command (CNMOC), the Naval Oceanographic Office (NAVOCEANOO), and over a dozen UMS, buoy, and aquaculture industry partners. Our testing team includes talented data scientists capable of providing highly technical data exploration, analysis, and modeling for our partners, on which data-driven insights around platforms, sensors, and environmental information is created.
What is CUBEnet?
CUBEnet is a web application with a suite of data analysis tools, models, and query-able data that is used primarily in USM’s ocean testing area offshore Mississippi. The physical backbone of CUBEnet is our Ocean Cube test area used for training, testing, and evaluation (TT&E) located in the Gulf of Mexico. At 775 square kilometers with depths from 3 – 100 meters, significant in situ environmental data can be used for various end-user testing, evaluation, and even training. The test area is equipped with four (or more) moored ocean platforms and numerous uncrewed vessels. CUBEnet ingests (near) real-time oceanographic and meteorological data and generates user-selected data-driven products from a combination of model, satellite, uncrewed, and crewed platform data.
A Test & Evaluation Aid
Users can leverage high resolution hydrodynamic models—like HYCOM, AMSEAS, NGOFS2, NWPS, and COAWST—for both short and long-range mission planning and additionally compare their data against satellite data such as VIIRS and GOES-16. For example, USM scientists along with Ocean Aero, and NOAA recently demonstrated the ability of the Triton platform to collected dissolved oxygen for hypoxia, so it was critical to be able to display dissolved O2 and meteorological information for NOAA staff on the east coast on the CUBEnet dashboard. Figure 1 shows the real-time data from 20 meter dive by an uncrewed vessel in the CUBEnet platform. In this example, the descent and ascent times were 13 and 7 minutes, respectively. In Figure 2 the seafloor is annotated in red, and the window of data required for hypoxia analysis is in black. This location is part of a 4-year, monthly surveyed set of stations in the northern Gulf of Mexico which documented seasonal hypoxia. At the 20-meter site, the Triton recorded a dead zone at –20.8 meters depth suggesting confirmation of the presence of hypoxic (Dissolved O2 < 2 mg/L) areas near the coastal areas of the northern Gulf of Mexico. In this particular study, CUBEnet allowed USM and NOAA to quickly perform analysis of the collected water column data from each vertical profile, ascertain vehicle/sensor depth reached vs. bottom depth on profile dives, and determine Triton hypoxia survey operations were favorable and could meet NOAA hypoxia surveys in the future.

Fig 1: In addition to automated and interactive analysis of data, users can visualize satellite, hydrodynamic models, buoy, or maritime uncrewed systems data snapshots. (Image credit: USM

Fig 1: The sea floor is annotated in red, and the window of data required for hypoxia analysis is in black. (Image credit: USM)
CUBEnet Enhancements
Both Ocean Cube and CUBEnet are expanding at a fast pace. To meet the demand of T&E users, CUBEnet is developing new features. Soon, automated reports for pre-mission planning, test analysis, and post-mission reporting will be deployed on the CUBEnet portal. CUBEnet Automated Reporting System (CARS) will allow users to generate reports for a given timeframe. Some of its features in beta testing provide functionality for:
- The use of internal and external data to create modules for attributes of platforms
- AUVs, ASVs, gliders, and buoys
- Expanding geophysical sensor support (e.g., magnetic, gravity, acoustic)
- Automatically collecting data and insights in digestible graphs
- Integration of USM and user AI (Artificial Intelligence) and ML (Machine Learning) algorithms to improve predictive models
From a user perspective the workflow is simple and intuitive and follows from basic questions such as: “I would like to generate a report on a mission in a specific timeframe.” After which the user selects the timeframe and platform to obtain the report. Optionally, the user can select specific attributes (sensors, etc.) of the platform for analysis. The report is then compiled as a downloadable PDF.

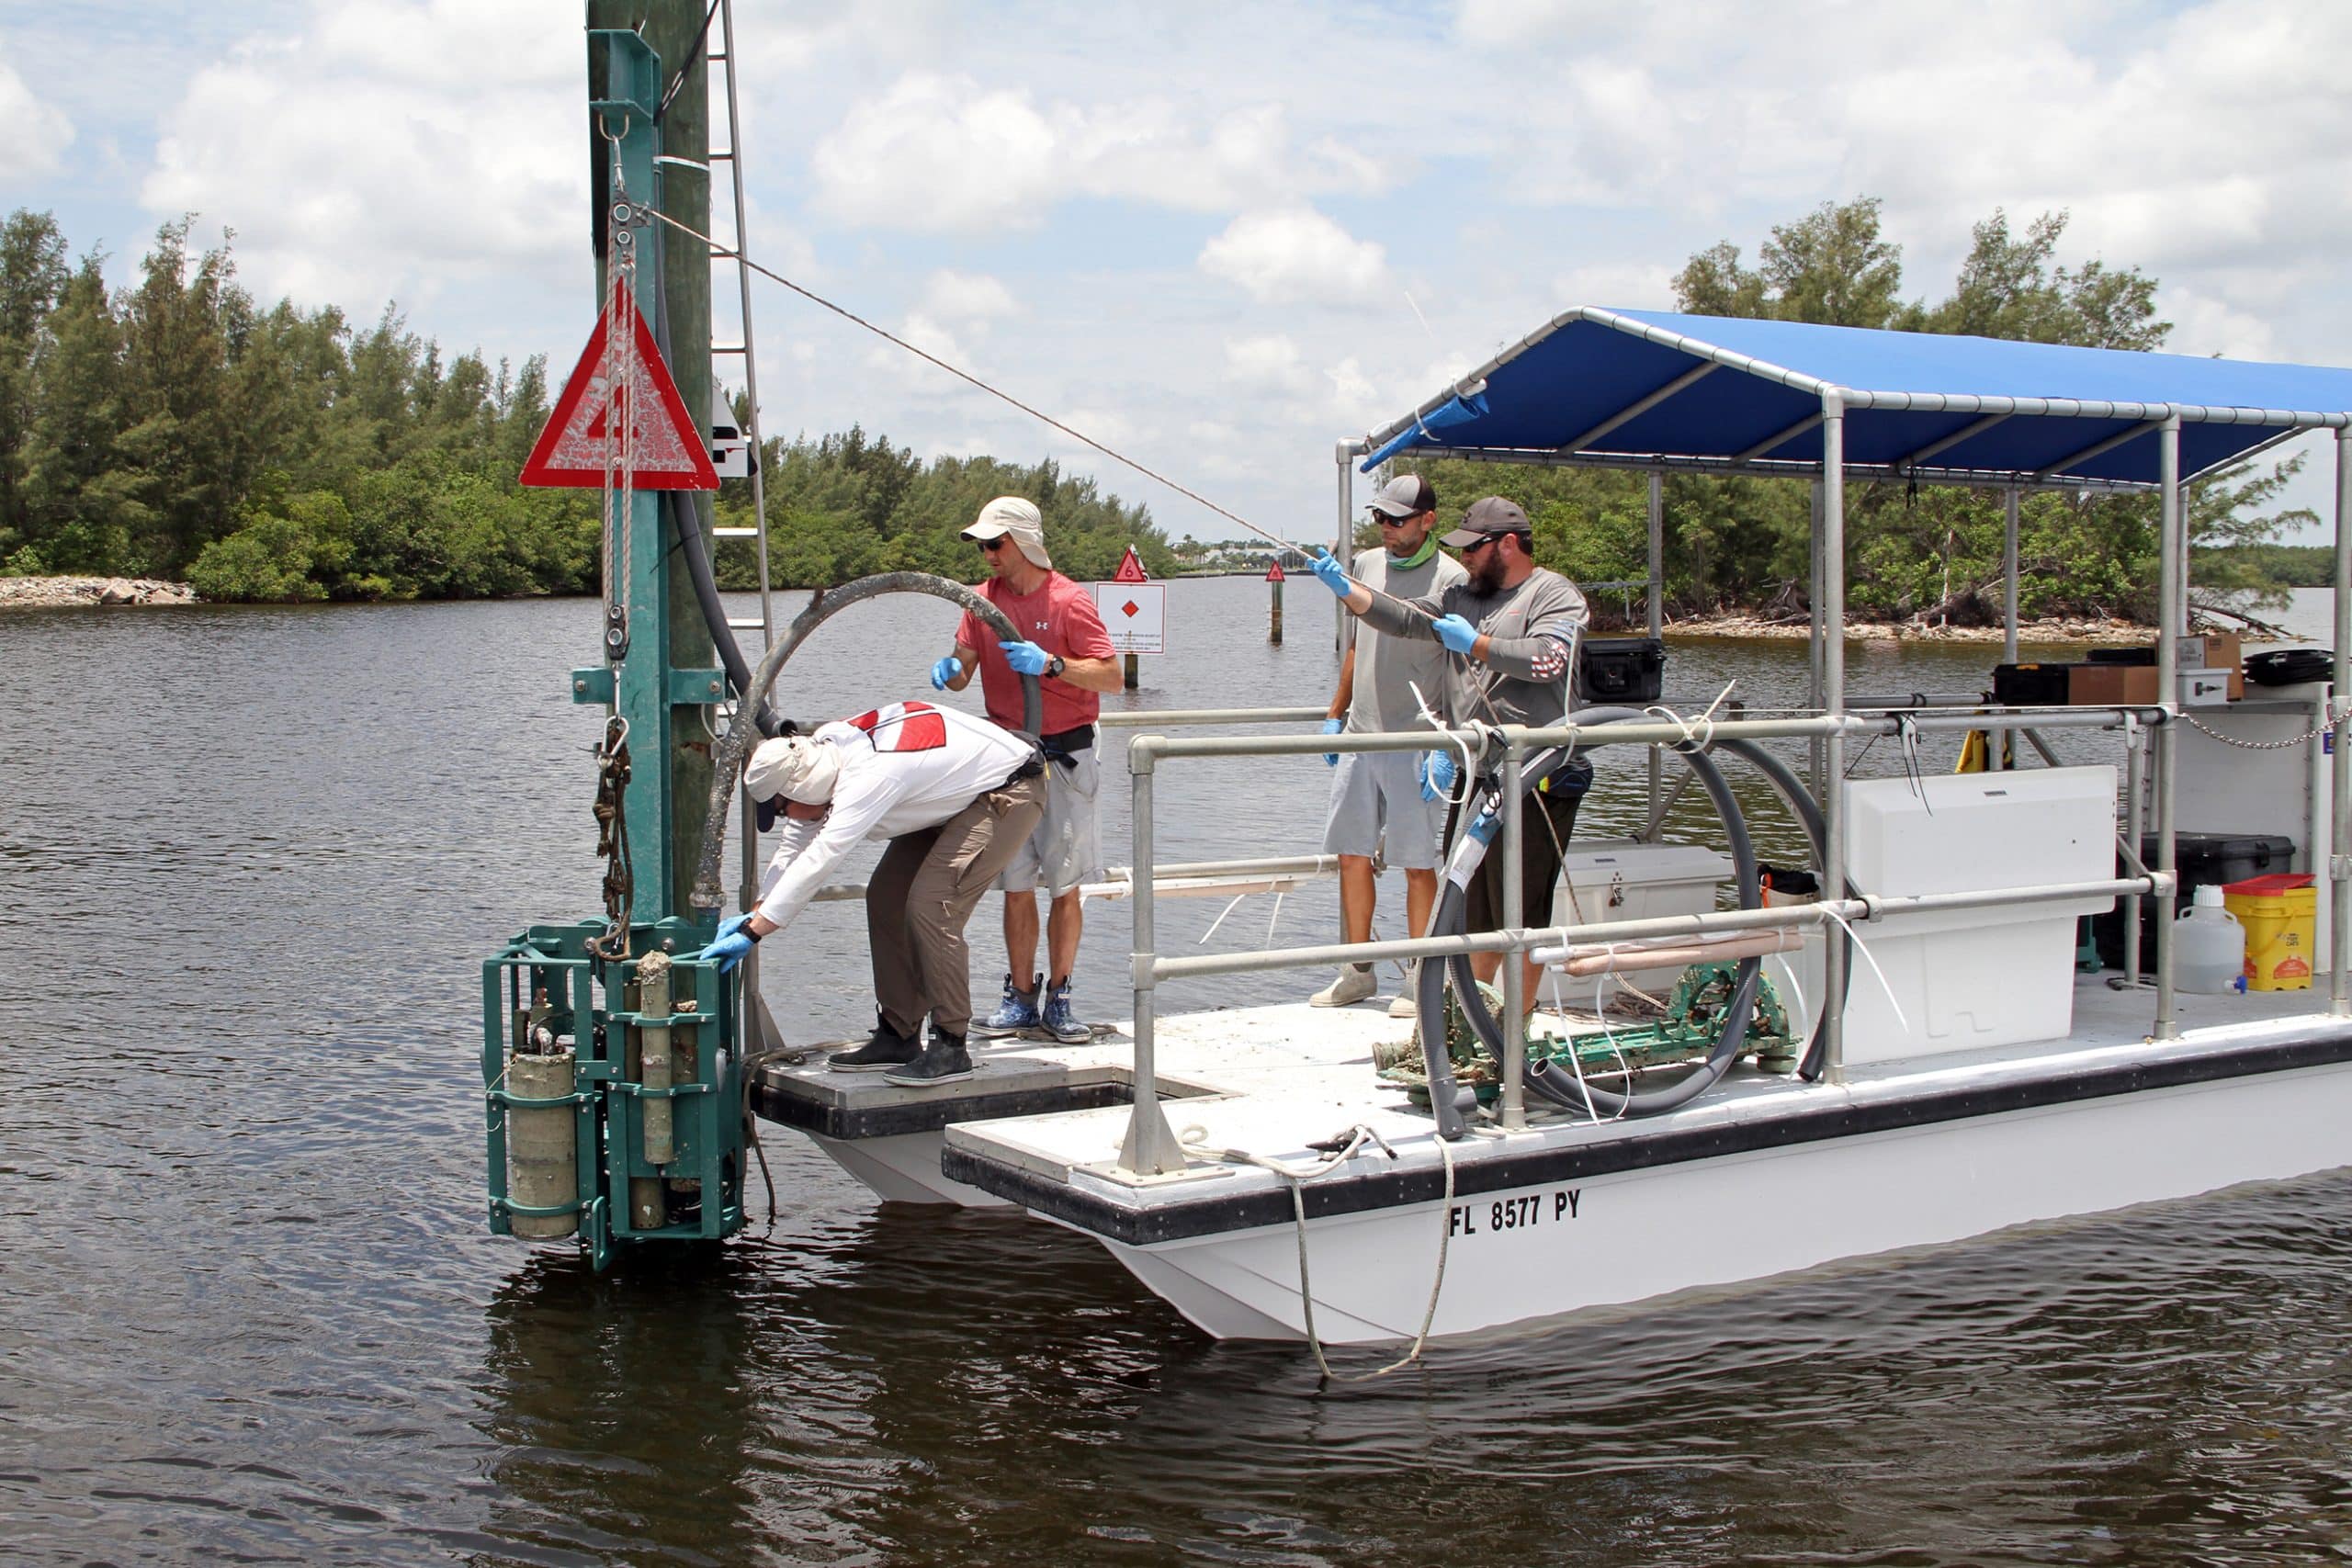
Waverider Buoy being readied for deployment CUBEnet Test Area in the Gulf of Mexico from the R/V Point Sur. (Image credit: USM)
Automated test reporting is just one of several enhancements in progress. We are planning to rollout modules that include AI/ML analysis using internally trained models based on CUBEnet observational data. Furthermore, internal models will be improved using more advanced deep learning techniques as uncrewed data is ingested over time.
Dive into CUBEnet ocean observations and data, visit: http://oceancube.usm.edu/
This feature appeared in Environment, Coastal & Offshore (ECO) Magazine’s 2023 Deep Dive I special edition Ocean Observation, to read more access the magazine here.

