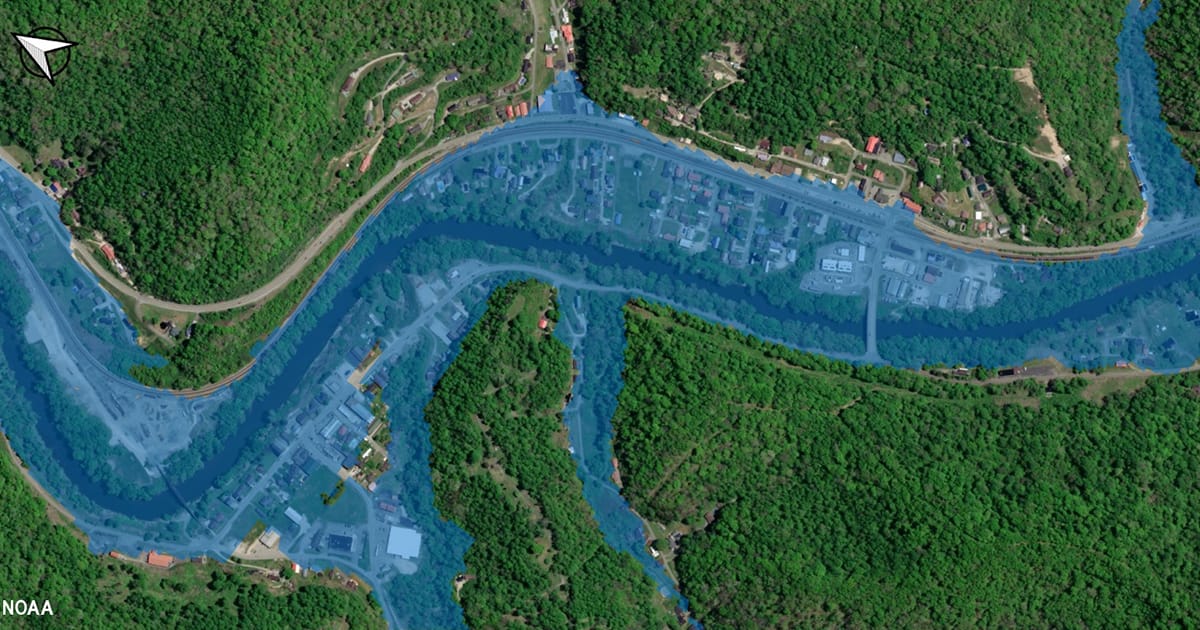
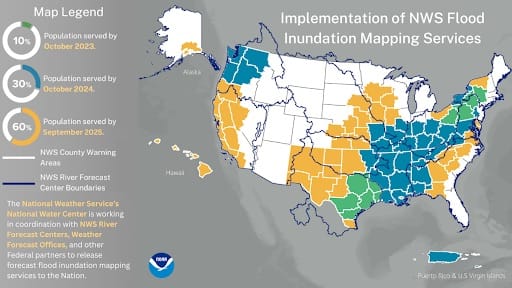
The FIM provides near-real-time, high-resolution, street-level visualizations of flood waters to assist NWS forecasters in issuing flood watches and warnings. FIM services are now available to twice as many NWS weather forecast offices with new coverage for:
- Hawaii and the West Coast;
- Portions of South-Central Alaska, including the Cook Inlet, Kenai Peninsula, Copper River, and Prince William Sound watersheds;
- The Southwest and Great Plains; and
- The Great Lakes and the interior Southeast.
“Flooding is the most frequent severe weather-related threat, and our costliest natural disaster,” said David Vallee, Director, Service Innovation and Partnership Division, NOAA’s National Water Center. “Expanding our FIM availability has been a game-changer in providing actionable, real-time information to emergency and water resource managers, and will expand the delivery of impact-based decision support services to our core partners who work to keep Americans safe and informed.”
FIM helps provide approximate spatial estimates of land area that is covered in water, based on modeled forecast river flows and current conditions, with detailed information on where flooding impacts may occur.
About NOAA’s Flood Inundation Mapping
FIM services launched in 2023 for 10% of the country, serving portions of Louisiana, New York, Pennsylvania, and Texas. In 2024, FIM expanded to cover 30% of the US population, covering areas stretching from the Mid-Atlantic and eastern Great Lakes to the Lower Mississippi Valley and central Gulf Coast region, Washington, and parts of Oregon in the Pacific Northwest region, and Puerto Rico and the US Virgin Islands.
The expanded FIM maps are available on the National Water Prediction Service website and in several geographic information system applications.
There are four unique maps available in near-real time for the Lower 48 and parts of south-central Alaska:
- National Water Model-derived hourly inundation analysis of current conditions
- National Water Model streamflow prediction based on a five-day inundation forecast
- NWS River Forecast Center (RFC) streamflow prediction-based five-day inundation forecast
- Static “categorical” FIM (CatFIM) maps for select NWS River Forecast Points within the FIM domain
FIM services will be slightly different for Hawaii, Puerto Rico, and the US Virgin Islands to capture the fast-response floods on these rivers and streams. As the precipitation forecasting models are different for these areas when compared with the continental US, a 48-hour forecast based on National Water Model streamflow predictions will be used to create FIM instead of the five-day flood inundation forecasts from the National Water Model and RFCs.
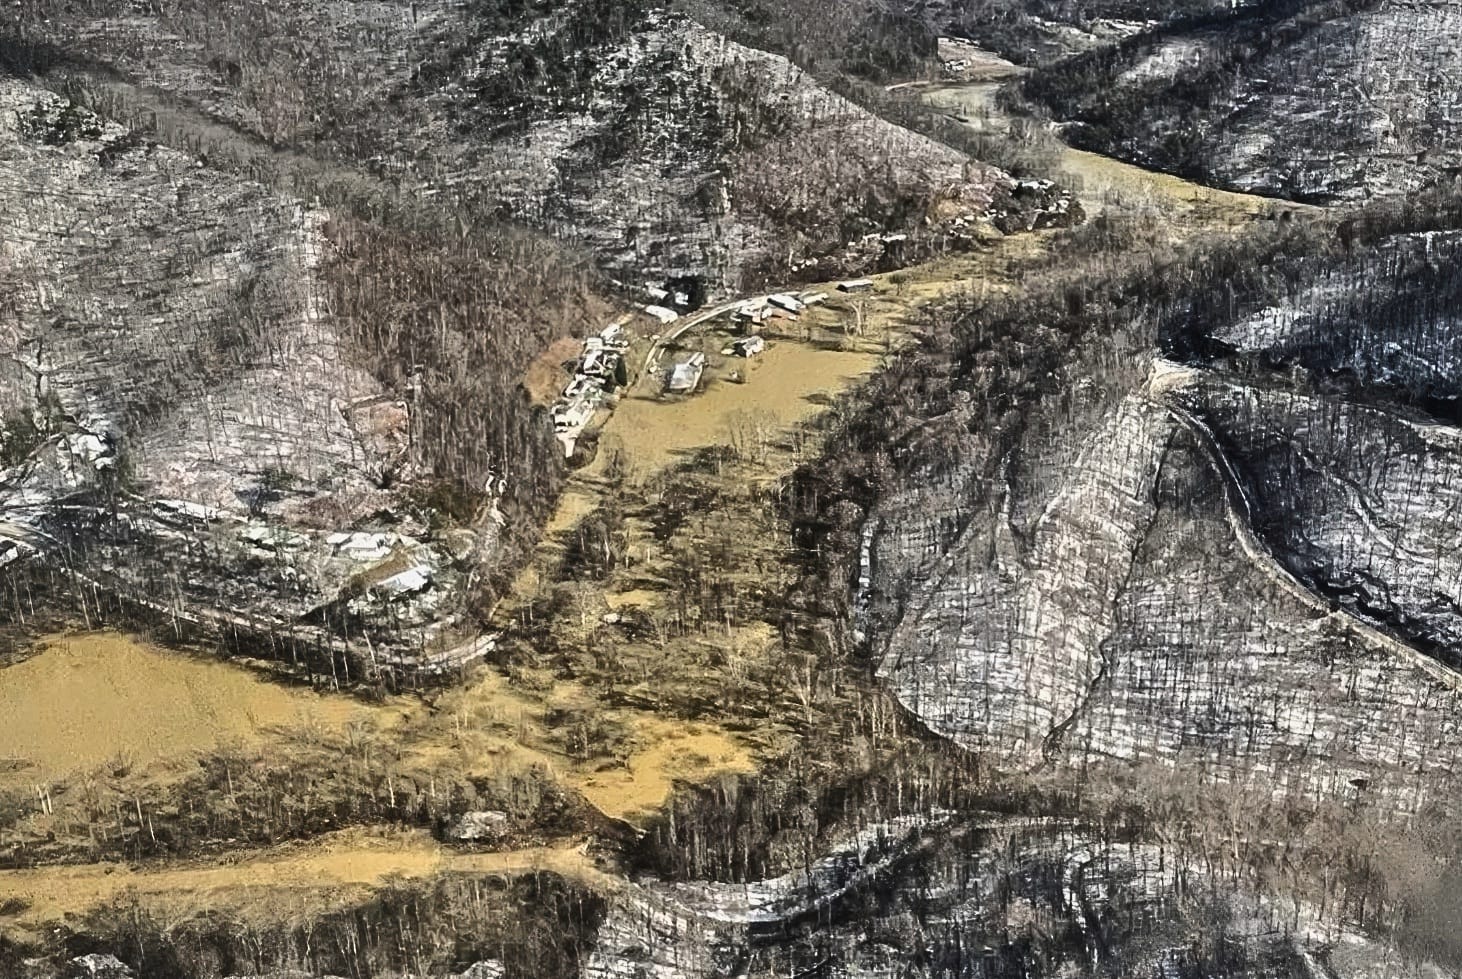
Looking ahead
In 2026, FIM will be fully deployed in communities nationwide and available for 110,000 river miles near and downstream of NWS RFC forecast point locations. It will also be available for more than 3.6 million river miles covered by National Water Model forecasts.